Delta VolDelta Volume BTC - Multi Pair
Description The Delta Volume BTC - Multi Pair indicator visualizes the balance between buying and selling volume across multiple Bitcoin exchanges. By analyzing price action within each bar, it provides insight into underlying market pressure that traditional volume indicators miss. This indicator allows traders to:
Compare volume flow across Coinbase, Binance, and Binance Perpetual markets
Identify divergences between exchanges that may signal market shifts
Detect accumulation or distribution patterns through volume imbalances
View exchanges individually or in aggregate for comprehensive analysis
Calculation Methods The indicator offers three volume delta calculation methods:
VWAP Based (default):
price_range = high - low
buy_percent = (close - low) / price_range
sell_percent = (high - close) / price_range
delta = volume * (buy_percent - sell_percent)
This method distributes volume based on where price closed within the bar's range, providing a nuanced view of buying/selling pressure.
Tick Based :
delta = volume * sign(hlc3 - previous_hlc3)
This approach assigns volume based on the direction of typical price movement between bars, capturing momentum between periods.
Simple :
delta = close > open ? volume : close < open ? -volume : 0
A straightforward method that assigns positive volume to up bars and negative volume to down bars.
When Aggregate Mode is enabled, the indicator sums the volume deltas from all selected exchanges:
aggregate_delta = coinbase_delta + binance_delta + binance_perp_delta
Features
Multi-Exchange Support : Track volume delta across Coinbase, Binance, and Binance Perpetual futures
Advanced Calculation Methods : Choose between VWAP-based, tick-based, or simple volume delta algorithms
Flexible Display Options : Visualize as histogram, columns, area, or line charts
Customizable Colors : Distinct color schemes for each exchange and direction
Smoothing Options : Apply EMA, SMA, or WMA to reduce noise
Aggregate Mode : Combine all exchanges to see total market flow
How to Use
Individual Exchange Analysis : Uncheck "Aggregate Mode" to see each exchange separately, revealing where smart money may be positioning
Divergence Detection : Watch for one exchange showing buying while others show selling
Volume Trend Confirmation : Strong price moves should be accompanied by strong delta in the same direction
Liquidity Analysis : Compare spot vs futures volume delta to identify market sentiment shifts
The Delta Volume BTC - Multi Pair indicator helps identify the "hidden" buying and selling pressure that may not be apparent from price action alone, giving you an edge in understanding market dynamics across the Bitcoin ecosystem.
Поиск скриптов по запросу "smart money"

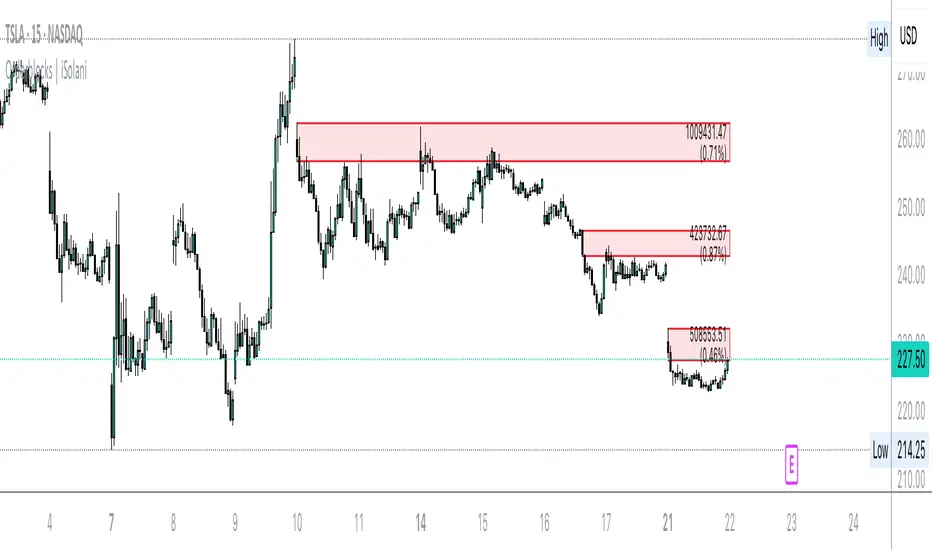
Orderblocks | iSolani
Revealing Institutional Footprints: The iSolani Volume-Powered Order Block System
Where Smart Money Leaves Its Mark – Automated Zone Detection for Discretionary Traders
Core Methodology
Pressure-Weighted Volume Analysis
Calculates directional commitment using candle position:
Buying Pressure = Total Volume × (Closing Price – Low) / (High – Low)
Selling Pressure = Total Volume × (High – Closing Price) / (High – Low)
Normalizes values against 31-period EMAs to filter retail noise
Adaptive Block Triggering
Identifies significant zones when:
Absolute Buy/Sell Difference > 4× SMA of Historical Differences (default)
Price closes bullishly (green block) or bearishly (red block)
Self-Maintaining Visualization
Blocks auto-extend rightward until price breaches critical level
Invalidated zones removed in real-time via array management
Technical Innovation
Dynamic Threshold Adjustment
Multiplier parameter (default 4) automatically scales with market volatility
Institutional-Grade Metrics
Blocks display:
Volume disparity in absolute terms
Percentage deviation from 33-period average
Directional bias through color-coding
Efficient Memory Handling
O(n) complexity cleanup routine prevents chart lag
System Workflow
Calculates real-time buy/sell pressure ratios
Compares to historical average (31-period default)
Generates semi-transparent zones (85% opacity) at spike locations
Monitors price interaction with block boundaries
Automatically retracts invalid zones
Standard Configuration
Sensitivity : 4× multiplier (ideal for 15m-4h charts)
Visuals : Red/green blocks with white text labels
Duration : 50-bar default extension
Volume Baseline : 33-period EMA filter
Boundary Check : Close beyond block high/low triggers deletion
This system transforms raw market data into a institutional roadmap – not by predicting turns, but by revealing where concentrated volume makes turns statistically probable. The color-coded blocks serve as persistent yet adaptive markers of where professional liquidity resides.
Daily Open @Alpha PipsOverview
The Daily Open @Alpha Pips indicator displays the daily opening price as a reference line on the chart. This level is widely used by traders to gauge market sentiment, potential support/resistance zones, and price reactions throughout the trading session.
How It Works
The line color is red with a 30% transparency level, ensuring visibility without overwhelming the chart.
The line width is set to 2 for clear visualization.
Use Cases
Identify potential intraday support/resistance at the daily open.
Observe price reactions around the daily open level to refine entries and exits.
Use in conjunction with price action, order flow, or smart money concepts for enhanced decision-making.
Additional Information
Works on any timeframe but is best suited for intraday trading strategies.
The script is fully transparent, ensuring traders can easily understand its function.
It does not repaint, providing reliable and stable levels throughout the session.

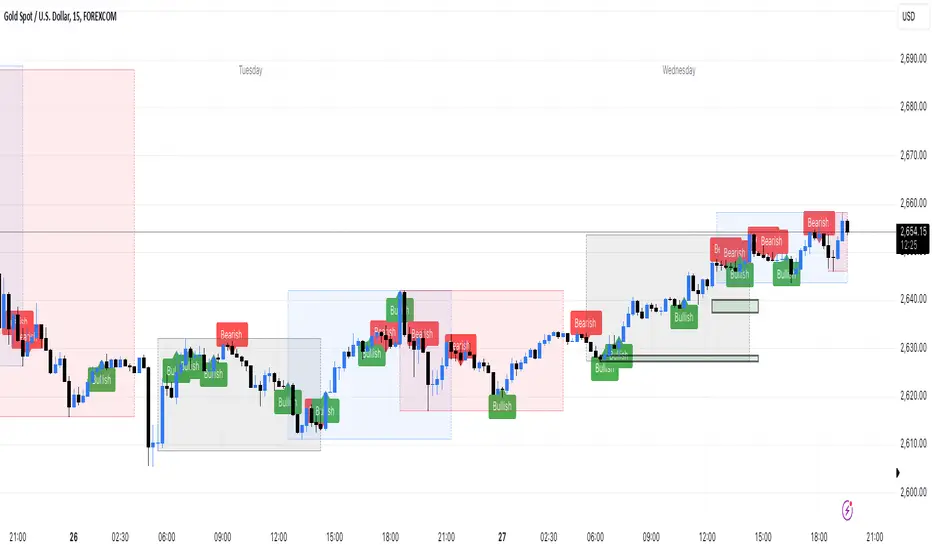
Twitter Model ICT [TradingFinder] MMXM ERL D + FVG + M15 MSS/SMT🔵 Introduction
The Twitter Model ICT is a trading approach based on ICT (Inner Circle Trader) models, focusing on price movement between external and internal liquidity in lower timeframes. This model integrates key concepts such as Market Structure Shift (MSS), Smart Money Technique (SMT) divergence, and CISD level break to identify precise entry points in the market.
The primary goal of this model is to determine key liquidity levels, such as the previous day’s high and low (PDH/PDL) and align them with the Fair Value Gap (FVG) in the 1-hour timeframe. The overall strategy involves framing trades around the 1H FVG and using the M15 Market Structure Shift (MSS) for entry confirmation.
The Twitter Model ICT is designed to utilize external liquidity levels, such as PDH/PDL, as key entry zones. The model identifies FVG in the 1-hour timeframe, which acts as a magnet for price movement. Additionally, traders confirm entries using M15 Market Structure Shift (MSS) and SMT divergence.
Bullish Twitter Model :
In a bullish setup, the price sweeps the previous day’s low (PDL), and after confirming reversal signals, buys are executed in internal liquidity zones. Conversely, in a bearish setup, the price sweeps the previous day’s high (PDH), and after confirming weakness signals, sells are executed.
Bearish Twitter Model :
In short setups, entries are only executed above the Midnight Open, while in long setups, entries are taken below the Midnight Open. Adhering to these principles allows traders to define precise entry and exit points and analyze price movement with greater accuracy based on liquidity and market structure.
🔵 How to Use
The Twitter Model ICT is a liquidity-based trading strategy that analyzes price movements relative to the previous day’s high and low (PDH/PDL) and Fair Value Gap (FVG). This model is applicable in both bullish and bearish directions and utilizes the 1-hour (1H) and 15-minute (M15) timeframes for entry confirmation.
The price first sweeps an external liquidity level (PDH or PDL) and then provides an entry opportunity based on Market Structure Shift (MSS) and SMT divergence. Additionally, the entry should be positioned relative to the Midnight Open, meaning long entries should occur below the Midnight Open and short entries above it.
🟣 Bullish Twitter Model
In a bullish setup, the price first sweeps the previous day’s low (PDL) and reaches an external liquidity level. Then, in the 1-hour timeframe (1H), a bullish Fair Value Gap (FVG) forms, which serves as the price target.
To confirm the entry, a Market Structure Shift (MSS) in the 15-minute timeframe (M15) should be observed, signaling a trend reversal to the upside. Additionally, SMT divergence with correlated assets can indicate weakness in selling pressure.
Under these conditions, a long position is taken below the Midnight Open, with a stop-loss placed at the lowest point of the recent bearish move. The price target for this trade is the FVG in the 1-hour timeframe.
🟣 Bearish Twitter Model
In a bearish setup, the price first sweeps the previous day’s high (PDH) and reaches an external liquidity level. Then, in the 1-hour timeframe (1H), a bearish Fair Value Gap (FVG) is identified, serving as the trade target.
To confirm entry, a Market Structure Shift (MSS) in the 15-minute timeframe (M15) should form, signaling a trend shift to the downside. If an SMT divergence is present, it can provide additional confirmation for the trade.
Once these conditions are met, a short position is taken above the Midnight Open, with a stop-loss placed at the highest level of the recent bullish move. The trade's price target is the FVG in the 1-hour timeframe.
🔵 Settings
Bar Back Check : Determining the return of candles to identify the CISD level.
CISD Level Validity : CISD level validity period based on the number of candles.
Daily Position : Determines whether only the first signal of the day is considered or if signals are evaluated throughout the entire day.
Session : Specifies in which trading sessions the indicator will be active.
Second Symbol : This setting allows you to select another asset for comparison with the primary asset. By default, "XAUUSD" (Gold) is set as the second symbol, but you can change it to any currency pair, stock, or cryptocurrency. For example, you can choose currency pairs like EUR/USD or GBP/USD to identify divergences between these two assets.
Divergence Fractal Periods : This parameter defines the number of past candles to consider when identifying divergences. The default value is 2, but you can change it to suit your preferences. This setting allows you to detect divergences more accurately by selecting a greater number of candles.
The indicator allows displaying sessions based on various time zones. The user can select one of the following options :
UTC (Coordinated Universal Time)
Local Time of the Session
User’s Local Time
Show Open Price : Displays the New York market opening price.
Show PDH / PDL : Displays the previous day’s high and low to identify potential entry points.
Show SMT Divergence : Displays lines and labels for bullish ("+SMT") and bearish ("-SMT") divergences.
🔵 Conclusion
The Twitter Model ICT is an effective approach for analyzing and executing trades in financial markets, utilizing a combination of liquidity principles, market structure, and SMT confirmations to identify optimal entry and exit points.
By analyzing the previous day’s high and low (PDH/PDL), Fair Value Gaps (FVG), and Market Structure Shift (MSS) in the 1H and M15 timeframes, traders can pinpoint liquidity-driven trade opportunities. Additionally, considering the Midnight Open level helps traders avoid random entries and ensures better trade placement.
By applying this model, traders can interpret market movements based on liquidity flow and structural changes, allowing them to fine-tune their trading decisions with higher precision. Ultimately, the Twitter Model ICT provides a structured and logical approach for traders who seek to trade based on liquidity behavior and trend shifts in the market.

Order Blocks with Volume Heatmap & Clusters - VK TradingOrder Blocks with Volume Heatmap & Clusters - VK Trading
This script is designed to identify and highlight Order Blocks, a key concept in institutional trading, and combines it with powerful tools like volume heatmaps and accumulation clusters for enhanced market analysis. Suitable for traders of all experience levels, this script provides a clear and customizable visualization to help identify significant market zones effectively.
What Does This Script Do?
Order Block Identification: Highlights bullish and bearish order blocks directly on the chart, making it easier to spot key supply and demand zones.
Volume Heatmap: A dynamic heatmap adjusts colors based on relative volume, allowing you to quickly identify areas of heightened activity.
Institutional Accumulation Clusters: Zones of potential institutional accumulation are calculated using a combination of ATR (Average True Range), standardized volume, and RSI (Relative Strength Index).
Automatic Clearing: Invalidated order blocks are automatically removed, ensuring your charts remain clean and focused.
Key Features
Customizable Sensitivity: Adjust the script’s sensitivity to tailor order block detection to different market conditions and strategies.
Advanced Volume Display Options: Toggle volume visibility on or off. Customize the position, size, and color of volume labels for better integration with your chart's design.
Dynamic Heatmap Intensity: Fine-tune the heatmap’s intensity and color to highlight areas of interest based on trading volume.
Dual Order Block Detection: Uses two independent detection settings to analyze the market from multiple perspectives.
Visual Alerts: Automatically draws key level lines based on detected order blocks for better clarity.
User Benefits:
Clear Market Analysis: Helps pinpoint institutional activity and key levels with minimal effort.
Increased Efficiency: Automates plotting and analysis, allowing you to focus on decision-making.
Versatile Compatibility: Complements strategies like Smart Money Concepts, Wyckoff, and Price Action approaches.
Disclaimer
This script is intended as an analytical and educational tool. It does not guarantee specific outcomes or eliminate trading risks. Use this tool at your own discretion and always practice proper risk management.

ICT Dealing RangeICT Dealing Range
This indicator identifies and plots ICT (Inner Circle Trader) Dealing Ranges - key institutional areas where smart money accumulates or distributes positions before significant moves.
What is a Dealing Range?
A Dealing Range is a significant price area where institutional traders accumulate or distribute their positions. These ranges form through a specific sequence of price movements that indicate institutional order flow:
Bullish Dealing Range Sequence:
1. Initial High (H)
2. Initial Low (L)
3. Higher High (HH)
4. Lower Low (LL)
5. Break above HH (confirmation)
Bearish Dealing Range Sequence:
1. Initial Low (L)
2. Initial High (H)
3. Lower Low (LL)
4. Higher High (HH)
5. Break below LL (confirmation)
My Trading Strategy
Entry Methods:
1. Range Extreme Retests:
- After range formation, wait for price to return to either extreme
- Long entries at range bottom with stops below
- Short entries at range top with stops above
2. Mid-Line Strategy:
- Use the mid-line as a pivot point for reversals
- Long entries on mid-line bounce with stops below
- Short entries on mid-line rejection with stops above
Stop Loss Placement:
- When entering at extremes: Place stops beyond the mid
- When entering at mid-line: Place stops beyond the opposing extreme
- Always respect the structure's boundaries
Take Profit Targets:
- Minimum 2:1 Risk-Reward ratio
- For extreme entries: Target the opposite extreme
- For mid-line entries: Target the nearest extreme
Risk Management
- Never enter without a clear invalidation point
- Maintain minimum 2:1 RR ratio
- Consider market structure and higher timeframe context
Indicator Features
- Auto-detection of dealing range patterns
- Color-coded boxes (green for bullish, red for bearish)
- Optional mid-line display
- Customizable colors and styles
- Adjustable pivot lookback periods
Notes
This tool is based on ICT concepts but should be used in conjunction with other forms of analysis. The dealing range provides a framework for understanding institutional order flow, but proper risk management and market context are essential for successful trading.
Remember: The best trades often come from clean retests of these ranges after their initial formation. Patience in waiting for proper setups is key to successful implementation.

VPSA-VTDDear Sir/Madam,
I am pleased to present the next iteration of my indicator concept, which, in my opinion, serves as a highly useful tool for analyzing markets using the Volume Spread Analysis (VSA) method or the Wyckoff methodology.
The VPSA (Volume-Price Spread Analysis), the latest version in the family of scripts I’ve developed, appears to perform its task effectively. The combination of visualizing normalized data alongside their significance, achieved through the application of Z-Score standardization, proved to be a sound solution. Therefore, I decided to take it a step further and expand my project with a complementary approach to the existing one.
Theory
At the outset, I want to acknowledge that I’m aware of the existence of other probabilistic models used in financial markets, which may describe these phenomena more accurately. However, in line with Occam's Razor, I aimed to maintain simplicity in the analysis and interpretation of the concepts below. For this reason, I focused on describing the data using the Gaussian distribution.
The data I read from the chart — primarily the closing price, the high-low price difference (spread), and volume — exhibit cyclical patterns. These cycles are described by Wyckoff's methodology, while VSA complements and presents them from a different perspective. I will refrain from explaining these methods in depth due to their complexity and broad scope. What matters is that within these cycles, various events occur, described by candles or bars in distinct ways, characterized by different spreads and volumes. When observing the chart, I notice periods of lower volatility, often accompanied by lower volumes, as well as periods of high volatility and significant volumes. It’s important to find harmony within this apparent chaos. I think that chart interpretation cannot happen without considering the broader context, but the more variables I include in the analytical process, the more challenges arise. For instance, how can I determine if something is large (wide) or small (narrow)? For elements like volume or spread, my script provides a partial answer to this question. Now, let’s get to the point.
Technical Overview
The first technique I applied is Min-Max Normalization. With its help, the script adjusts volume and spread values to a range between 0 and 1. This allows for a comparable bar chart, where a wide bar represents volume, and a narrow one represents spread. Without normalization, visually comparing values that differ by several orders of magnitude would be inconvenient. If the indicator shows that one bar has a unit spread value while another has half that value, it means the first bar is twice as large. The ratio is preserved.
The second technique I used is Z-Score Standardization. This concept is based on the normal distribution, characterized by variables such as the mean and standard deviation, which measures data dispersion around the mean. The Z-Score indicates how many standard deviations a given value deviates from the population mean. The higher the Z-Score, the more the examined object deviates from the mean. If an object has a Z-Score of 3, it falls within 0.1% of the population, making it a rare occurrence or even an anomaly. In the context of chart analysis, such strong deviations are events like climaxes, which often signal the end of a trend, though not always. In my script, I assigned specific colors to frequently occurring Z-Score values:
Below 1 – Blue
Above 1 – Green
Above 2 – Red
Above 3 – Fuchsia
These colors are applied to both spread and volume, allowing for quick visual interpretation of data.
Volume Trend Detector (VTD)
The above forms the foundation of VPSA. However, I have extended the script with a Volume Trend Detector (VTD). The idea is that when I consider market structure - by market structure, I mean the overall chart, support and resistance levels, candles, and patterns typical of spread and volume analysis as well as Wyckoff patterns - I look for price ranges where there is a lack of supply, demand, or clues left behind by Smart Money or the market's enigmatic identity known as the Composite Man. This is essential because, as these clues and behaviors of market participants — expressed through the chart’s dynamics - reflect the actions, decisions, and emotions of all players. These behaviors can help interpret the bull-bear battle and estimate the probability of their next moves, which is one of the key factors for a trader relying on technical analysis to make a trade decision.
I enhanced the script with a Volume Trend Detector, which operates in two modes:
Step-by-Step Logic
The detector identifies expected volume dynamics. For instance, when looking for signs of a lack of bullish interest, I focus on setups with decreasing volatility and volume, particularly for bullish candles. These setups are referred to as No Demand patterns, according to Tom Williams' methodology.
Simple Moving Average (SMA)
The detector can also operate based on a simple moving average, helping to identify systematic trends in declining volume, indicating potential imbalances in market forces.
I’ve designed the program to allow the selection of candle types and volume characteristics to which the script will pay particular attention and notify me of specific market conditions.
Advantages and Disadvantages
Advantages:
Unified visualization of normalized spread and volume, saving time and improving efficiency.
The use of Z-Score as a consistent and repeatable relative mechanism for marking examined values.
The use of colors in visualization as a reference to Z-Score values.
The possibility to set up a continuous alert system that monitors the market in real time.
The use of EMA (Exponential Moving Average) as a moving average for Z-Score.
The goal of these features is to save my time, which is the only truly invaluable resource.
Disadvantages:
The assumption that the data follows a normal distribution, which may lead to inaccurate interpretations.
A fixed analysis period, which may not be perfectly suited to changing market conditions.
The use of EMA as a moving average for Z-Score, listed both as an advantage and a disadvantage depending on market context.
I have included comments within the code to explain the logic behind each part. For those who seek detailed mathematical formulas, I invite you to explore the code itself.
Defining Program Parameters:
Numerical Conditions:
VPSA Period for Analysis – The number of candles analyzed.
Normalized Spread Alert Threshold – The expected normalized spread value; defines how large or small the spread should be, with a range of 0-1.00.
Normalized Volume Alert Threshold – The expected normalized volume value; defines how large or small the volume should be, with a range of 0-1.00.
Spread Z-SCORE Alert Threshold – The Z-SCORE value for the spread; determines how much the spread deviates from the average, with a range of 0-4 (a higher value can be entered, but from a logical standpoint, exceeding 4 is unnecessary).
Volume Z-SCORE Alert Threshold – The Z-SCORE value for volume; determines how much the volume deviates from the average, with a range of 0-4 (the same logical note as above applies).
Logical Conditions:
Logical conditions describe whether the expected value should be less than or equal to or greater than or equal to the numerical condition.
All four parameters accept two possibilities and are analogous to the numerical conditions.
Volume Trend Detector:
Volume Trend Detector Period for Analysis – The analysis period, indicating the number of candles examined.
Method of Trend Determination – The method used to determine the trend. Possible values: Step by Step or SMA.
Trend Direction – The expected trend direction. Possible values: Upward or Downward.
Candle Type – The type of candle taken into account. Possible values: Bullish, Bearish, or Any.
The last available setting is the option to enable a joint alert for VPSA and VTD.
When enabled, VPSA will trigger on the last closed candle, regardless of the VTD analysis period.
Example Use Cases (Labels Visible in the Script Window Indicate Triggered Alerts):
The provided labels in the chart window mark where specific conditions were met and alerts were triggered.
Summary and Reflections
The program I present is a strong tool in the ongoing "game" with the Composite Man.
However, it requires familiarity and understanding of the underlying methodologies to fully utilize its potential.
Of course, like any technical analysis tool, it is not without flaws. There is no indicator that serves as a perfect Grail, accurately signaling Buy or Sell in every case.
I would like to thank those who have read through my thoughts to the end and are willing to take a closer look at my work by using this script.
If you encounter any errors or have suggestions for improvement, please feel free to contact me.
I wish you good health and accurately interpreted market structures, leading to successful trades!
CatTheTrader

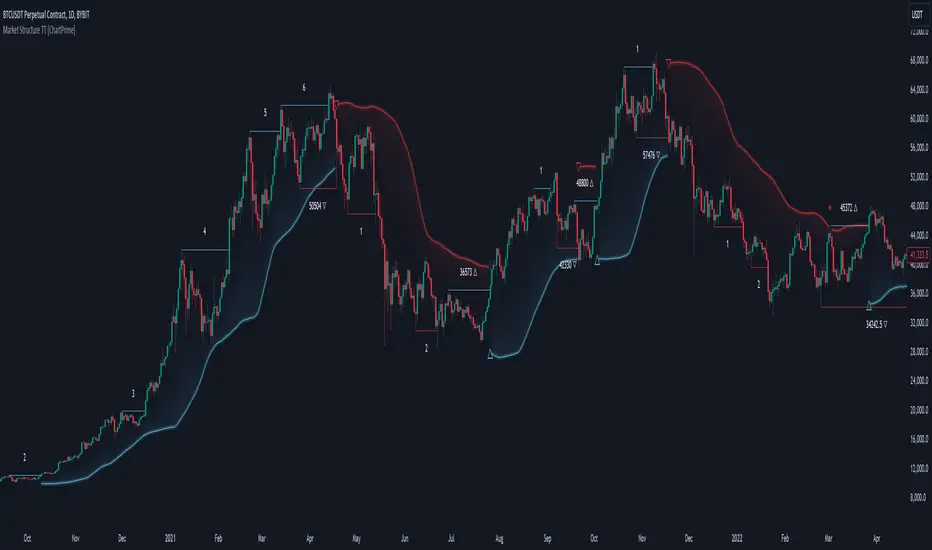
Market Structure Trend Targets [ChartPrime]The Market Structure Trend Targets indicator is designed to identify trend direction and continuation points by marking significant breaks in price levels. This approach helps traders track trend strength and potential reversal points. The indicator uses previous highs and lows as breakout triggers, providing a visual roadmap for trend continuation or mean reversion signals.
⯁ KEY FEATURES AND HOW TO USE
⯌ Breakout Points with Numbered Markers :
The indicator identifies key breakout points where price breaks above a previous high (for uptrends) or below a previous low (for downtrends). The initial breakout (zero break) is marked with the entry price and a triangle icon, while subsequent breakouts within the trend are numbered sequentially (1, 2, 3…) to indicate trend continuation.
Example of breakout markers for uptrend and downtrend:
⯌ Percentage Change Display Option :
Traders can toggle on a setting to display the percentage change from the initial breakout point to each subsequent break level, offering an easy way to gauge trend momentum over time. This is particularly helpful for identifying how far price has moved in the current trend.
Percentage change example between break points:
⯌ Dynamic Stop Loss Levels :
In uptrends, the stop loss level is placed below the price to protect against downside moves. In downtrends, it is positioned above the price. If the price breaches the stop loss level, the indicator resets, indicating a potential end or reversal of the trend.
Dynamic stop loss level illustration in uptrend and downtrend:
⯌ Mean Reversion Signals :
The indicator identifies potential mean reversion points with diamond icons. In an uptrend, if the price falls below the stop loss and then re-enters above it, a diamond is plotted, suggesting a possible mean reversion. Similarly, in a downtrend, if the price moves above the stop loss and then falls back below, it indicates a reversion possibility.
Mean reversion diamond signals on the chart:
⯌ Trend Visualization with Colored Zones :
The chart background is shaded to visually represent trend direction, with color changes corresponding to uptrends and downtrends. This makes it easier to see overall market conditions at a glance.
⯁ USER INPUTS
Length : Defines the number of bars used to identify pivot highs and lows for trend breakouts.
Display Percentage : Option to toggle between showing sequential breakout numbers or the percentage change from the initial breakout.
Colors for Uptrend and Downtrend : Allows customization of color zones for uptrends and downtrends to match individual chart preferences.
⯁ CONCLUSION
The Market Structure Trend Targets indicator offers a strategic way to monitor market trends, track breakouts, and manage risk through dynamic stop loss levels. Its clear visual representation of trend continuity, alongside mean reversion signals, provides traders with actionable insights for both trend-following and counter-trend strategies.
Order Blocks - VK TradingOrder Blocks - VK Trading
This script in Pine Script identifies and highlights Order Blocks, key tools in institutional trading. Designed for traders of all levels, it provides clear and customizable visualization, helping you anticipate market movements with greater accuracy.
Key Features:
Order Block Visualization: Highlights relevant bullish and bearish zones directly on the chart.
Customizable Settings: Adjust sensitivity, colors, and other parameters to suit your analysis needs.
Dual Block Detection: Uses two independent settings to cover different market perspectives.
Visual Alerts: Automatic line drawing for key levels.
Automatic Clearing: Dynamic clearing of already invalidated blocks.
User Benefits:
Clear Visual Analysis: Identifies key supply and demand points used by institutions.
Improved Trading Decisions: Anticipate entry and exit zones more accurately.
Time Saver: Automates level plotting, allowing you to focus on strategy and execution.
Strategy Adaptability: Compatible with Smart Money, Wyckoff, and Price Action approaches.
Disclaimer:
This script is an educational and analytical tool. It does not guarantee specific results or eliminate trading risk. Trading in the financial markets involves significant risks; use this script at your own risk.

Hidden SMT Divergence ICT 01 [TradingFinder] HSMT SMC Technique🔵 Introduction
Hidden SMT Divergence, an advanced concept within the Smart Money Technique (SMT), identifies discrepancies between correlated assets by focusing on their closing prices.
Unlike the standard SMT Divergence, which uses high and low prices for analysis, Hidden SMT Divergence uncovers subtle signals by examining divergences based on the assets' closing values.
These divergences often highlight potential reversals or trend continuations, making this technique a valuable tool for traders aiming to anticipate market movements.
This approach applies across various markets and asset classes, including :
Commodities : CAPITALCOM:GOLD vs. CAPITALCOM:SILVER or BLACKBULL:BRENT vs. BLACKBULL:WTI .
Indices : NASDAQ:NDX vs. TVC:SPX vs. FX:US30 .
FOREX : FX:EURUSD vs. OANDA:GBPUSD vs. TVC:DXY (US Dollar Index).
Cryptocurrencies : BITSTAMP:BTCUSD vs. COINBASE:ETHUSD vs. KUCOIN:SOLUSDT vs. CRYPTOCAP:TOTAL3 .
Volatility Measures : FOREXCOM:XAUUSD vs. TVC:VIX (Volatility Index).
By identifying divergences within these asset groups, traders can gain actionable insights into potential market reversals or shifts in trend direction. Hidden SMT Divergence is particularly effective for pinpointing subtle market signals that traditional methods may overlook.
Bullish Hidden SMT Divergence : This divergence emerges when one asset forms a higher low, while the correlated asset creates a lower low in terms of their closing prices. It often signals weakening downward momentum and a potential reversal to the upside.
Bearish Hidden SMT Divergence : This occurs when one asset establishes a higher high, while the correlated asset forms a lower high based on their closing prices. It typically reflects declining upward momentum and a probable shift to the downside.
🔵 How to Use
The Hidden SMT Divergence indicator provides traders with a systematic approach to identify market reversals or trend continuations through divergences in closing prices between two correlated assets.
🟣 Bullish Hidden SMT Divergence
Bullish Hidden SMT Divergence occurs when the closing price of the primary asset forms a higher low, while the correlated asset creates a lower low. This pattern indicates weakening downward momentum and signals a potential reversal to the upside.
After identifying the divergence, confirm it using additional tools like support levels, volume trends, or indicators such as RSI and MACD. Enter a buy position as the price shows signs of reversal near support zones, ensuring proper risk management by placing a stop-loss below the support level.
Bearish Hidden SMT Divergence
Bearish Hidden SMT Divergence is identified when the closing price of the primary asset forms a higher high, while the correlated asset creates a lower high. This divergence suggests a weakening uptrend and a likely reversal to the downside.
Validate the signal by examining resistance levels, declining volume, or complementary indicators. Consider entering a sell position as the price starts declining from resistance levels, and set a stop-loss above the resistance zone to limit potential losses.
🔵 Setting
Second Symbol : Select the secondary asset to compare with the primary asset. By default, "XAUUSD" (Gold) is used, but it can be customized to any stock, cryptocurrency, or currency pair.
Divergence Fractal Periods : Defines the number of past candles considered for identifying divergences. The default value is 2, but traders can adjust it for greater precision.
Bullish Divergence Line : Displays a dashed line connecting the points of bullish divergence.
Bearish Divergence Line : Shows a similar line for bearish divergence points.
Bullish Divergence Label : Marks areas of bullish divergence with a "+SMT" label.
Bearish Divergence Label : Highlights bearish divergences with a "-SMT" label.
Chart Type : Choose between Line or Candle charts for enhanced visualization.
🔵 Conclusion
Hidden SMT Divergence offers traders a refined method for identifying market reversals by analyzing closing price discrepancies between correlated assets. Its ability to uncover subtle divergences makes it an essential tool for traders who aim to stay ahead of market trends.
By integrating this technique with other technical analysis tools and sound risk management, traders can enhance their decision-making process and capitalize on market opportunities with greater confidence.
Hidden SMT Divergence’s focus on closing prices ensures more precise signals, helping traders refine their strategies across various markets, including Forex, commodities, indices, and cryptocurrencies.
Its open-source nature allows for customization and verification, providing transparency and flexibility to suit diverse trading needs. Hidden SMT Divergence stands as a powerful addition to the arsenal of any trader seeking to unlock hidden opportunities in dynamic financial markets.

lib_smcLibrary "lib_smc"
This is an adaptation of LuxAlgo's Smart Money Concepts indicator with numerous changes. Main changes include integration of object based plotting, plenty of performance improvements, live tracking of Order Blocks, integration of volume profiles to refine Order Blocks, and many more.
This is a library for developers, if you want this converted into a working strategy, let me know.
buffer(item, len, force_rotate)
Parameters:
item (float)
len (int)
force_rotate (bool)
buffer(item, len, force_rotate)
Parameters:
item (int)
len (int)
force_rotate (bool)
buffer(item, len, force_rotate)
Parameters:
item (Profile type from robbatt/lib_profile/32)
len (int)
force_rotate (bool)
swings(len)
INTERNAL: detect swing points (HH and LL) in given range
Parameters:
len (simple int) : range to check for new swing points
Returns: values are the price level where and if a new HH or LL was detected, else na
method init(this)
Namespace types: OrderBlockConfig
Parameters:
this (OrderBlockConfig)
method delete(this)
Namespace types: OrderBlock
Parameters:
this (OrderBlock)
method clear_broken(this, broken_buffer)
INTERNAL: delete internal order blocks box coordinates if top/bottom is broken
Namespace types: map
Parameters:
this (map)
broken_buffer (map)
Returns: any_bull_ob_broken, any_bear_ob_broken, broken signals are true if an according order block was broken/mitigated, broken contains the broken block(s)
create_ob(id, mode, start_t, start_i, top, end_t, end_i, bottom, break_price, early_confirmation_price, config, init_plot, force_overlay)
INTERNAL: set internal order block coordinates
Parameters:
id (int)
mode (int) : 1: bullish, -1 bearish block
start_t (int)
start_i (int)
top (float)
end_t (int)
end_i (int)
bottom (float)
break_price (float)
early_confirmation_price (float)
config (OrderBlockConfig)
init_plot (bool)
force_overlay (bool)
Returns: signals are true if an according order block was broken/mitigated
method align_to_profile(block, align_edge, align_break_price)
Namespace types: OrderBlock
Parameters:
block (OrderBlock)
align_edge (bool)
align_break_price (bool)
method create_profile(block, opens, tops, bottoms, closes, values, resolution, vah_pc, val_pc, args, init_calculated, init_plot, force_overlay)
Namespace types: OrderBlock
Parameters:
block (OrderBlock)
opens (array)
tops (array)
bottoms (array)
closes (array)
values (array)
resolution (int)
vah_pc (float)
val_pc (float)
args (ProfileArgs type from robbatt/lib_profile/32)
init_calculated (bool)
init_plot (bool)
force_overlay (bool)
method create_profile(block, resolution, vah_pc, val_pc, args, init_calculated, init_plot, force_overlay)
Namespace types: OrderBlock
Parameters:
block (OrderBlock)
resolution (int)
vah_pc (float)
val_pc (float)
args (ProfileArgs type from robbatt/lib_profile/32)
init_calculated (bool)
init_plot (bool)
force_overlay (bool)
track_obs(swing_len, hh, ll, top, btm, bull_bos_alert, bull_choch_alert, bear_bos_alert, bear_choch_alert, min_block_size, max_block_size, config_bull, config_bear, init_plot, force_overlay, enabled, extend_blocks, clear_broken_buffer_before, align_edge_to_value_area, align_break_price_to_poc, profile_args_bull, profile_args_bear, use_soft_confirm, soft_confirm_offset, use_retracements_with_FVG_out)
Parameters:
swing_len (int)
hh (float)
ll (float)
top (float)
btm (float)
bull_bos_alert (bool)
bull_choch_alert (bool)
bear_bos_alert (bool)
bear_choch_alert (bool)
min_block_size (float)
max_block_size (float)
config_bull (OrderBlockConfig)
config_bear (OrderBlockConfig)
init_plot (bool)
force_overlay (bool)
enabled (bool)
extend_blocks (simple bool)
clear_broken_buffer_before (simple bool)
align_edge_to_value_area (simple bool)
align_break_price_to_poc (simple bool)
profile_args_bull (ProfileArgs type from robbatt/lib_profile/32)
profile_args_bear (ProfileArgs type from robbatt/lib_profile/32)
use_soft_confirm (simple bool)
soft_confirm_offset (float)
use_retracements_with_FVG_out (simple bool)
method draw(this, config, extend_only)
Namespace types: OrderBlock
Parameters:
this (OrderBlock)
config (OrderBlockConfig)
extend_only (bool)
method draw(blocks, config)
INTERNAL: plot order blocks
Namespace types: array
Parameters:
blocks (array)
config (OrderBlockConfig)
method draw(blocks, config)
INTERNAL: plot order blocks
Namespace types: map
Parameters:
blocks (map)
config (OrderBlockConfig)
method cleanup(this, ob_bull, ob_bear)
removes all Profiles that are older than the latest OrderBlock from this profile buffer
Namespace types: array
Parameters:
this (array type from robbatt/lib_profile/32)
ob_bull (OrderBlock)
ob_bear (OrderBlock)
_plot_swing_points(mode, x, y, show_swing_points, linecolor_swings, keep_history, show_latest_swings_levels, trail_x, trail_y, trend)
INTERNAL: plot swing points
Parameters:
mode (int) : 1: bullish, -1 bearish block
x (int) : x-coordingate of swing point to plot (bar_index)
y (float) : y-coordingate of swing point to plot (price)
show_swing_points (bool) : switch to enable/disable plotting of swing point labels
linecolor_swings (color) : color for swing point labels and lates level lines
keep_history (bool) : weater to remove older swing point labels and only keep the most recent
show_latest_swings_levels (bool)
trail_x (int) : x-coordinate for latest swing point (bar_index)
trail_y (float) : y-coordinate for latest swing point (price)
trend (int) : the current trend 1: bullish, -1: bearish, to determine Strong/Weak Low/Highs
_pivot_lvl(mode, trend, hhll_x, hhll, super_hhll, filter_insignificant_internal_breaks)
INTERNAL: detect whether a structural level has been broken and if it was in trend direction (BoS) or against trend direction (ChoCh), also track the latest high and low swing points
Parameters:
mode (simple int) : detect 1: bullish, -1 bearish pivot points
trend (int) : current trend direction
hhll_x (int) : x-coordinate of newly detected hh/ll (bar_index)
hhll (float) : y-coordinate of newly detected hh/ll (price)
super_hhll (float) : level/y-coordinate of superior hhll (if this is an internal structure pivot level)
filter_insignificant_internal_breaks (bool) : if true pivot points / internal structure will be ignored where the wick in trend direction is longer than the opposite (likely to push further in direction of main trend)
Returns: coordinates of internal structure that has been broken (x,y): start of structure, (trail_x, trail_y): tracking hh/ll after structure break, (bos_alert, choch_alert): signal whether a structural level has been broken
_plot_structure(x, y, is_bos, is_choch, line_color, line_style, label_style, label_size, keep_history)
INTERNAL: plot structural breaks (BoS/ChoCh)
Parameters:
x (int) : x-coordinate of newly broken structure (bar_index)
y (float) : y-coordinate of newly broken structure (price)
is_bos (bool) : whether this structural break was in trend direction
is_choch (bool) : whether this structural break was against trend direction
line_color (color) : color for the line connecting the structural level and the breaking candle
line_style (string) : style (line.style_dashed/solid) for the line connecting the structural level and the breaking candle
label_style (string) : style (label.style_label_down/up) for the label above/below the line connecting the structural level and the breaking candle
label_size (string) : size (size.small/tiny) for the label above/below the line connecting the structural level and the breaking candle
keep_history (bool) : weater to remove older swing point labels and only keep the most recent
structure_values(length, super_hh, super_ll, filter_insignificant_internal_breaks)
detect (and plot) structural breaks and the resulting new trend
Parameters:
length (simple int) : lookback period for swing point detection
super_hh (float) : level/y-coordinate of superior hh (for internal structure detection)
super_ll (float) : level/y-coordinate of superior ll (for internal structure detection)
filter_insignificant_internal_breaks (bool) : if true pivot points / internal structure will be ignored where the wick in trend direction is longer than the opposite (likely to push further in direction of main trend)
Returns: trend: direction 1:bullish -1:bearish, (bull_bos_alert, bull_choch_alert, top_x, top_y, trail_up_x, trail_up): whether and which level broke in a bullish direction, trailing high, (bbear_bos_alert, bear_choch_alert, tm_x, btm_y, trail_dn_x, trail_dn): same in bearish direction
structure_plot(trend, bull_bos_alert, bull_choch_alert, top_x, top_y, trail_up_x, trail_up, hh, bear_bos_alert, bear_choch_alert, btm_x, btm_y, trail_dn_x, trail_dn, ll, color_bull, color_bear, show_swing_points, show_latest_swings_levels, show_bos, show_choch, line_style, label_size, keep_history)
detect (and plot) structural breaks and the resulting new trend
Parameters:
trend (int) : crrent trend 1: bullish, -1: bearish
bull_bos_alert (bool) : if there was a bullish bos alert -> plot it
bull_choch_alert (bool) : if there was a bullish choch alert -> plot it
top_x (int) : latest shwing high x
top_y (float) : latest swing high y
trail_up_x (int) : trailing high x
trail_up (float) : trailing high y
hh (float) : if there was a higher high
bear_bos_alert (bool) : if there was a bearish bos alert -> plot it
bear_choch_alert (bool) : if there was a bearish chock alert -> plot it
btm_x (int) : latest swing low x
btm_y (float) : latest swing low y
trail_dn_x (int) : trailing low x
trail_dn (float) : trailing low y
ll (float) : if there was a lower low
color_bull (color) : color for bullish BoS/ChoCh levels
color_bear (color) : color for bearish BoS/ChoCh levels
show_swing_points (bool) : whether to plot swing point labels
show_latest_swings_levels (bool) : whether to track and plot latest swing point levels with lines
show_bos (bool) : whether to plot BoS levels
show_choch (bool) : whether to plot ChoCh levels
line_style (string) : whether to plot BoS levels
label_size (string) : label size of plotted BoS/ChoCh levels
keep_history (bool) : weater to remove older swing point labels and only keep the most recent
structure(length, color_bull, color_bear, super_hh, super_ll, filter_insignificant_internal_breaks, show_swing_points, show_latest_swings_levels, show_bos, show_choch, line_style, label_size, keep_history, enabled)
detect (and plot) structural breaks and the resulting new trend
Parameters:
length (simple int) : lookback period for swing point detection
color_bull (color) : color for bullish BoS/ChoCh levels
color_bear (color) : color for bearish BoS/ChoCh levels
super_hh (float) : level/y-coordinate of superior hh (for internal structure detection)
super_ll (float) : level/y-coordinate of superior ll (for internal structure detection)
filter_insignificant_internal_breaks (bool) : if true pivot points / internal structure will be ignored where the wick in trend direction is longer than the opposite (likely to push further in direction of main trend)
show_swing_points (bool) : whether to plot swing point labels
show_latest_swings_levels (bool) : whether to track and plot latest swing point levels with lines
show_bos (bool) : whether to plot BoS levels
show_choch (bool) : whether to plot ChoCh levels
line_style (string) : whether to plot BoS levels
label_size (string) : label size of plotted BoS/ChoCh levels
keep_history (bool) : weater to remove older swing point labels and only keep the most recent
enabled (bool)
_check_equal_level(mode, len, eq_threshold, enabled)
INTERNAL: detect equal levels (double top/bottom)
Parameters:
mode (int) : detect 1: bullish/high, -1 bearish/low pivot points
len (int) : lookback period for equal level (swing point) detection
eq_threshold (float) : maximum price offset for a level to be considered equal
enabled (bool)
Returns: eq_alert whether an equal level was detected and coordinates of the first and the second level/swing point
_plot_equal_level(show_eq, x1, y1, x2, y2, label_txt, label_style, label_size, line_color, line_style, keep_history)
INTERNAL: plot equal levels (double top/bottom)
Parameters:
show_eq (bool) : whether to plot the level or not
x1 (int) : x-coordinate of the first level / swing point
y1 (float) : y-coordinate of the first level / swing point
x2 (int) : x-coordinate of the second level / swing point
y2 (float) : y-coordinate of the second level / swing point
label_txt (string) : text for the label above/below the line connecting the equal levels
label_style (string) : style (label.style_label_down/up) for the label above/below the line connecting the equal levels
label_size (string) : size (size.tiny) for the label above/below the line connecting the equal levels
line_color (color) : color for the line connecting the equal levels (and it's label)
line_style (string) : style (line.style_dotted) for the line connecting the equal levels
keep_history (bool) : weater to remove older swing point labels and only keep the most recent
equal_levels_values(len, threshold, enabled)
detect (and plot) equal levels (double top/bottom), returns coordinates
Parameters:
len (int) : lookback period for equal level (swing point) detection
threshold (float) : maximum price offset for a level to be considered equal
enabled (bool) : whether detection is enabled
Returns: (eqh_alert, eqh_x1, eqh_y1, eqh_x2, eqh_y2) whether an equal high was detected and coordinates of the first and the second level/swing point, (eql_alert, eql_x1, eql_y1, eql_x2, eql_y2) same for equal lows
equal_levels_plot(eqh_x1, eqh_y1, eqh_x2, eqh_y2, eql_x1, eql_y1, eql_x2, eql_y2, color_eqh, color_eql, show, keep_history)
detect (and plot) equal levels (double top/bottom), returns coordinates
Parameters:
eqh_x1 (int) : coordinates of first point of equal high
eqh_y1 (float) : coordinates of first point of equal high
eqh_x2 (int) : coordinates of second point of equal high
eqh_y2 (float) : coordinates of second point of equal high
eql_x1 (int) : coordinates of first point of equal low
eql_y1 (float) : coordinates of first point of equal low
eql_x2 (int) : coordinates of second point of equal low
eql_y2 (float) : coordinates of second point of equal low
color_eqh (color) : color for the line connecting the equal highs (and it's label)
color_eql (color) : color for the line connecting the equal lows (and it's label)
show (bool) : whether plotting is enabled
keep_history (bool) : weater to remove older swing point labels and only keep the most recent
Returns: (eqh_alert, eqh_x1, eqh_y1, eqh_x2, eqh_y2) whether an equal high was detected and coordinates of the first and the second level/swing point, (eql_alert, eql_x1, eql_y1, eql_x2, eql_y2) same for equal lows
equal_levels(len, threshold, color_eqh, color_eql, enabled, show, keep_history)
detect (and plot) equal levels (double top/bottom)
Parameters:
len (int) : lookback period for equal level (swing point) detection
threshold (float) : maximum price offset for a level to be considered equal
color_eqh (color) : color for the line connecting the equal highs (and it's label)
color_eql (color) : color for the line connecting the equal lows (and it's label)
enabled (bool) : whether detection is enabled
show (bool) : whether plotting is enabled
keep_history (bool) : weater to remove older swing point labels and only keep the most recent
Returns: (eqh_alert) whether an equal high was detected, (eql_alert) same for equal lows
_detect_fvg(mode, enabled, o, h, l, c, filter_insignificant_fvgs, change_tf)
INTERNAL: detect FVG (fair value gap)
Parameters:
mode (int) : detect 1: bullish, -1 bearish gaps
enabled (bool) : whether detection is enabled
o (float) : reference source open
h (float) : reference source high
l (float) : reference source low
c (float) : reference source close
filter_insignificant_fvgs (bool) : whether to calculate and filter small/insignificant gaps
change_tf (bool) : signal when the previous reference timeframe closed, triggers new calculation
Returns: whether a new FVG was detected and its top/mid/bottom levels
_clear_broken_fvg(mode, upper_boxes, lower_boxes)
INTERNAL: clear mitigated FVGs (fair value gaps)
Parameters:
mode (int) : detect 1: bullish, -1 bearish gaps
upper_boxes (array) : array that stores the upper parts of the FVG boxes
lower_boxes (array) : array that stores the lower parts of the FVG boxes
_plot_fvg(mode, show, top, mid, btm, border_color, extend_box)
INTERNAL: plot (and clear broken) FVG (fair value gap)
Parameters:
mode (int) : plot 1: bullish, -1 bearish gap
show (bool) : whether plotting is enabled
top (float) : top level of fvg
mid (float) : center level of fvg
btm (float) : bottom level of fvg
border_color (color) : color for the FVG box
extend_box (int) : how many bars into the future the FVG box should be extended after detection
fvgs_values(o, h, l, c, filter_insignificant_fvgs, change_tf, enabled)
detect (and plot / clear broken) FVGs (fair value gaps), and return alerts and level values
Parameters:
o (float) : reference source open
h (float) : reference source high
l (float) : reference source low
c (float) : reference source close
filter_insignificant_fvgs (bool) : whether to calculate and filter small/insignificant gaps
change_tf (bool) : signal when the previous reference timeframe closed, triggers new calculation
enabled (bool) : whether detection is enabled
Returns: (bullish_fvg_alert, bull_top, bull_mid, bull_btm): whether a new bullish FVG was detected and its top/mid/bottom levels, (bearish_fvg_alert, bear_top, bear_mid, bear_btm): same for bearish FVGs
fvgs_plot(bullish_fvg_alert, bull_top, bull_mid, bull_btm, bearish_fvg_alert, bear_top, bear_mid, bear_btm, color_bull, color_bear, extend_box, show)
Parameters:
bullish_fvg_alert (bool)
bull_top (float)
bull_mid (float)
bull_btm (float)
bearish_fvg_alert (bool)
bear_top (float)
bear_mid (float)
bear_btm (float)
color_bull (color) : color for bullish FVG boxes
color_bear (color) : color for bearish FVG boxes
extend_box (int) : how many bars into the future the FVG box should be extended after detection
show (bool) : whether plotting is enabled
Returns: (bullish_fvg_alert, bull_top, bull_mid, bull_btm): whether a new bullish FVG was detected and its top/mid/bottom levels, (bearish_fvg_alert, bear_top, bear_mid, bear_btm): same for bearish FVGs
fvgs(o, h, l, c, filter_insignificant_fvgs, change_tf, color_bull, color_bear, extend_box, enabled, show)
detect (and plot / clear broken) FVGs (fair value gaps)
Parameters:
o (float) : reference source open
h (float) : reference source high
l (float) : reference source low
c (float) : reference source close
filter_insignificant_fvgs (bool) : whether to calculate and filter small/insignificant gaps
change_tf (bool) : signal when the previous reference timeframe closed, triggers new calculation
color_bull (color) : color for bullish FVG boxes
color_bear (color) : color for bearish FVG boxes
extend_box (int) : how many bars into the future the FVG box should be extended after detection
enabled (bool) : whether detection is enabled
show (bool) : whether plotting is enabled
Returns: (bullish_fvg_alert): whether a new bullish FVG was detected, (bearish_fvg_alert): same for bearish FVGs
OrderBlock
Fields:
id (series int)
dir (series int)
left_top (chart.point)
right_bottom (chart.point)
break_price (series float)
early_confirmation_price (series float)
ltf_high (array)
ltf_low (array)
ltf_volume (array)
plot (Box type from robbatt/lib_plot_objects/49)
profile (Profile type from robbatt/lib_profile/32)
trailing (series bool)
extending (series bool)
awaiting_confirmation (series bool)
touched_break_price_before_confirmation (series bool)
soft_confirmed (series bool)
has_fvg_out (series bool)
hidden (series bool)
broken (series bool)
OrderBlockConfig
Fields:
show (series bool)
show_last (series int)
show_id (series bool)
show_profile (series bool)
args (BoxArgs type from robbatt/lib_plot_objects/49)
txt (series string)
txt_args (BoxTextArgs type from robbatt/lib_plot_objects/49)
delete_when_broken (series bool)
broken_args (BoxArgs type from robbatt/lib_plot_objects/49)
broken_txt (series string)
broken_txt_args (BoxTextArgs type from robbatt/lib_plot_objects/49)
broken_profile_args (ProfileArgs type from robbatt/lib_profile/32)
use_profile (series bool)
profile_args (ProfileArgs type from robbatt/lib_profile/32)

Engulfing bar detectorHere’s the updated description with the added step about using Fibonacci levels across timeframes for confirmation:
Liquidity Engulfing Bar Detector
The **Liquidity Engulfing Bar Detector** is a powerful tool designed for traders who want to identify high-probability reversal patterns in the market based on liquidity grabbing and price action. This indicator highlights **Bullish Engulfing** and **Bearish Engulfing** bars that fulfill specific liquidity criteria, helping you spot potential trend reversals and trading opportunities.
**Features**:
1. **Bullish Engulfing Bars**:
- The current candle's low dips below the previous candle's low (grabs liquidity).
- The current candle closes above the previous candle's open.
- A green label is plotted above the engulfing bar for easy identification.
2. **Bearish Engulfing Bars**:
- The current candle's high exceeds the previous candle's high (grabs liquidity).
- The current candle closes below the previous candle's open.
- A red label is plotted below the engulfing bar for clear visibility.
3. **Customizable Alerts**:
- Receive instant notifications via TradingView alerts when a bullish or bearish engulfing pattern is detected.
- Alerts are fully customizable, allowing you to stay updated without actively monitoring the chart.
4. **Visual Markers**:
- Clear and intuitive labels make it easy to spot key patterns directly on your chart.
- Fully integrated with any timeframe and market, ensuring versatility for all trading styles.
---
### **How to Use**:
1. **Add the Indicator**:
- Apply the Liquidity Engulfing Bar Detector to your chart to automatically highlight bullish and bearish engulfing bars.
2. **Enable Alerts**:
- Set up TradingView alerts to get notified of potential setups in real-time.
3. **Analyze with Fibonacci Levels**:
- Draw a Fibonacci retracement tool over the identified engulfing bar, from its low to its high (for bullish patterns) or high to low (for bearish patterns).
- Use the following Fibonacci levels as key zones of interest:
- **0.0 (start)**, **0.25**, **0.5 (midpoint)**, **0.75**, and **1.0 (end)**.
- These levels often act as critical support or resistance zones for price action.
4. **Use Multi-Timeframe Confirmation**:
- Validate zones from higher timeframes using lower timeframe candles:
- **1-minute candles** for confirming zones on the **15-minute chart**.
- **5-minute candles** for confirming zones on the **1-hour chart**.
- **15-minute candles** for confirming zones on the **4-hour chart**.
- This approach ensures precision in your entry points and aligns intraday movements with higher timeframe setups.
5. **Integrate with Your Strategy**:
- Combine the indicator with other tools (e.g., trendlines, moving averages, or volume analysis) for confirmation.
- Use proper risk management to maximize your trading edge.
---
### **Why Use This Indicator?**
Liquidity grabs often signal the participation of major market players, which can lead to significant reversals or continuations. By combining liquidity concepts with engulfing bar patterns and Fibonacci analysis, this indicator helps you:
- Identify key market turning points.
- Improve your entries and exits with multi-timeframe precision.
- Enhance your trading strategy with an edge rooted in smart money concepts.
---
**Note**: This indicator is best used with proper risk management and alongside other technical or fundamental analyses.
---
Let me know if there's anything more you'd like to include!
Price Action Dynamics Oscillator (PADO)1 minute ago
Price Action Dynamics Oscillator (PADO)
Indicator Overview and Technical Deep Dive
Concept and Philosophy
The Price Action Dynamics Oscillator (PADO) is a sophisticated technical analysis tool designed to provide multi-dimensional insights into market behavior by decomposing price action into manipulation and distribution metrics. The indicator goes beyond traditional momentum or trend indicators by introducing a nuanced approach to understanding market microstructure.
Key Architectural Components
1. Timeframe and Depth Selection
Pivot Depth Options:
Short Term (Length: 12 periods)
Intermediate Term (Length: 20 periods)
Long Term (Length: 100 periods)
This flexible configuration allows traders to adapt the indicator's sensitivity to different market conditions and trading styles.
2. Core Calculation Methodology
Manipulation Metrics
Calculates manipulation differently for green (bullish) and red (bearish) candles
Normalized against Average True Range (ATR) for consistent comparison across different volatility environments
Green Candle Manipulation: (Open - Low) / ATR
Red Candle Manipulation: (High - Open) / ATR
Distribution Metrics
Measures the directional strength and potential momentum shift
Green Candle Distribution: (Close - Open)
Red Candle Distribution: (Open - Close)
3. Normalization and Smoothing
Uses Simple Moving Average (SMA) for smoothing
Dynamic length calculation based on price range distance
Ensures minimum SMA length of 2 to prevent calculation errors
Unique Features
Visualization Toggles
Traders can selectively display:
Manipulation data
Distribution data
Long-term reference lines
Valuation metrics
Strategy signals
Valuation Comparative Analysis
Compares current manipulation and distribution metrics to 1000-bar long-term averages
Color-coded visualization for quick interpretation
Blue: Manipulation above average
Purple: Manipulation below average
Orange: Distribution above average
Yellow: Distribution below average
Strategy Deployment
Generates a composite strategy signal by comparing manipulation and distribution valuations
Uses Exponential Moving Average (EMA) for smoother signal generation
Incorporates volatility bands for context-aware signal interpretation
Quadrant Analysis
Classifies market state into four quadrants based on manipulation and distribution valuations:
Q1: Low Manipulation, High Distribution
Q2: High Manipulation, High Distribution
Q3: Low Manipulation, Low Distribution
Q4: High Manipulation, Low Distribution
Each quadrant is color-coded to provide visual market state representation.
Warning Signals
Manipulation Warning: When strategy crosses below low volatility band
Distribution Warning: When strategy crosses above high volatility band
Visual Indicators
Bar coloration based on strategy momentum
Multiple color states representing different market dynamics
Recommended Use Cases
Intraday and swing trading
Multi-timeframe market analysis
Volatility and momentum assessment
Trend reversal and continuation identification
Potential Limitations
Complexity might require significant trader education
Performance can vary across different market conditions
Requires careful parameter optimization
Recommended Settings
Best used on liquid markets with clear price action
Ideal for:
Forex
Futures
Large-cap stocks
Cryptocurrency pairs
Customization and Optimization
Traders should:
Backtest across multiple assets
Adjust timeframe settings
Calibrate visualization toggles
Use in conjunction with other technical indicators
Licensing
Mozilla Public License 2.0
Open-source and modification-friendly
Conclusion
The PADO represents an advanced approach to market analysis, blending traditional technical analysis with innovative metrics for deeper market understanding.
PADO Quadrant Color Analysis: Deep Dive
Quadrant Color Scheme Breakdown
Quadrant 1: Lime Green Background (RGB: 0, 255, 21, 90)
Condition: val_manip < 1 AND val_distr > 1
Market Interpretation:
Low Manipulation Pressure
High Distribution Activity
Potential Scenario:
Smart money might be gradually distributing positions
Trading Implications:
Caution for current trend followers
Potential preparation for trend change
Increased probability of consolidation or reversal
Quadrant 2: Bright Blue Background (RGB: 0, 191, 255, 90)
Condition: val_manip > 1 AND val_distr > 1
Market Interpretation:
High Manipulation Pressure
High Distribution Activity
Potential Scenario:
Strong institutional involvement
Potential market transition phase
Significant volume and momentum
Trading Implications:
High volatility expected
Increased market uncertainty
Potential for sharp price movements
Requires careful risk management
Quadrant 3: Light Gray Background (RGB: 252, 252, 252, 90)
Condition: val_manip < 1 AND val_distr < 1
Market Interpretation:
Low Manipulation Pressure
Low Distribution Activity
Potential Scenario:
Market consolidation
Reduced institutional activity
Potential low-volatility period
Trading Implications:
Range-bound market
Reduced trading opportunities
Potential setup for future breakout
Ideal for mean reversion strategies
Quadrant 4: Light Yellow Background (Hex: #f6ff0019)
Condition: val_manip > 1 AND val_distr < 1
Market Interpretation:
High Manipulation Pressure
Low Distribution Activity
Potential Scenario:
Accumulation of positions
Trading Implications:
Increased probability of directional move soon
Color Psychology and Technical Significance
Color Selection Rationale
Lime Green (Q1): Represents potential growth and transition
Bright Blue (Q2): Signifies high energy and institutional activity
Light Gray (Q3): Indicates neutrality and consolidation
Transparent Green (Q4): Suggests emerging trend potential
Advanced Interpretation Guidelines
Color Transition Analysis
Observe how the quadrant colors change
Rapid color shifts might indicate:
Market regime changes
Shifts in institutional sentiment
Potential trend acceleration or reversal
Technical Implementation Notes
Calculation Snippet
pinescriptCopyq1 = (val_manip < 1) and (val_distr > 1)
q2 = (val_manip > 1) and (val_distr > 1)
q3 = (val_manip < 1) and (val_distr < 1)
q4 = (val_manip > 1) and (val_distr < 1)
bgcolor(q1 ? color.rgb(0, 255, 21, 90):
q2 ? color.rgb(0, 191, 255, 90):
q3 ? color.rgb(252, 252, 252, 90):
q4 ? #f6ff0019:na)
Alpha Channel (Transparency)
90 and 0x19 values ensure background color doesn't overwhelm chart
Allows underlying price action to remain visible
Subtle visual cue without significant chart obstruction
Practical Trading Recommendations
Never Trade Solely on Quadrant Colors
Use as a complementary analysis tool
Combine with other technical and fundamental indicators
Timeframe Considerations
Validate quadrant signals across multiple timeframes
Longer timeframes provide more reliable signals
Risk Management
Set appropriate stop-loss levels
Use position sizing strategies
Be prepared for false signals
Recommended Workflow
Identify current quadrant
Assess overall market context
Confirm with other indicators
Execute with proper risk management

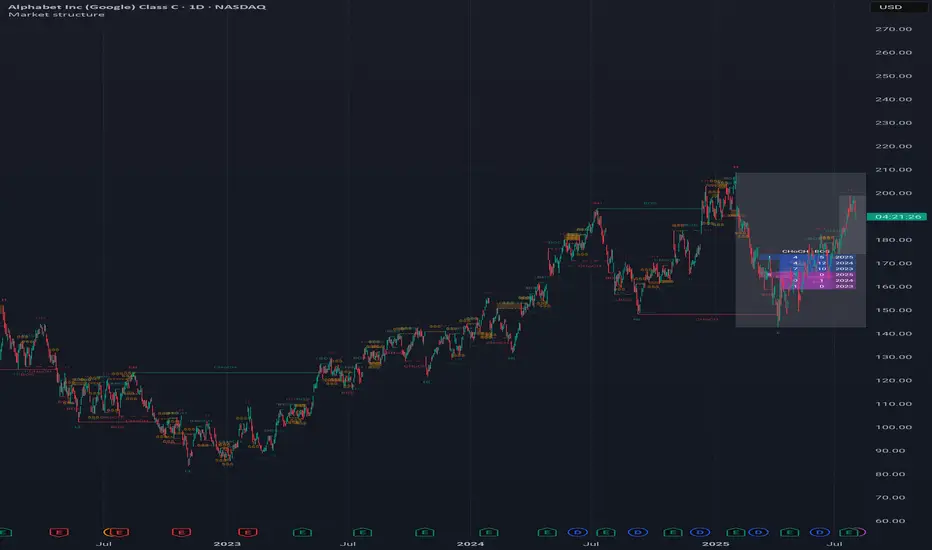
Market structureHi all!
This script shows you the market structure. You can choose to show internal market structure (with pivots of a default length of 5) and swing market structure (with pivots of a default length of 50). For these two trends it will show you:
• Break of structure (BOS)
• Change of character (CHoCH) (mandatory)
• Equal high/low (EQH/EQL)
It's inspired by "Smart Money Concepts (SMC) " by LuxAlgo that will also show you the market structure.
It will create the two market structures depending on the pivots found. Both of these market structures can be enabled/disabled. The pivots length can be configured separately. The pivots found will be the 'base' of this indicator and will show you when price breaks it. When that happens a break of structure or a change of character will be created. The latest 5 pivots found within the current trends will be kept to take action on. The internal market structure is shown with dashed lines and swing market structure is shown with solid lines.
A break of structure is removed if an earlier pivots within the same trend is broken. Like in the images below, the first pivot (in the first image) is removed when an earlier pivot's higher price within the same trend is broken (the second image):
Equal high/lows have a pink zone (by default but can be changed by the user). These zones can be configured to be extended to the right (off by default). Equal high/lows are only possible if it's not been broken by price and if a later bar has a high/low within the limit it's added to the zone (without it being more 'extreme' (high or low) then the previous price). A factor (percentage of width) of the Average True Length (of length 14) that the pivot must be within to to be considered an Equal high/low. This is configurable and sets this 'limit' and is 10 by default.
You are able to show the pivots that are used. "HH" (higher high), "HL" (higher low), "LH" (lower high), "LL" (lower low) and "H"/"L" (for pivots (high/low) when the trend has changed) are the labels used.
This script has proven itself useful for me to quickly see how the current market is. You can see the pivots (price and bar) where break of structure or change of character happens to see the current trends. I hope that you will find this useful for you.
When programming I focused on simplicity and ease of read. I did not focus on performance, I will do so if it's a problem (haven't noticed it is one yet).
You can set alerts for when a change of character happens. You can configure it to fire on when it happens (all or once per bar) but it defaults to 'once_per_bar_close' to avoid repainting. This has the drawback to alert you when the bar closes.
TLDR: this is an indicator showing you the market structure (break of structures and change of characters) using swing points/pivots. Two trends can be shown, internal (with pivots of length of 5) and swing (with pivots of the length of 50).
Best of trading luck!
SMC StrategyThis Pine Script strategy is based on Smart Money Concepts (SMC), designed for TradingView. Here's a brief summary of what the script does:
1. Swing High and Low Calculation: It identifies recent swing highs and lows, which are used to define key zones.
2. Equilibrium, Premium, and Discount Zones:
- Equilibrium is the midpoint between the swing high and low.
- Premium Zone is above the equilibrium, indicating a potential resistance area (sell zone).
- Discount Zone is below the equilibrium, indicating a potential support area (buy zone).
3. Simple Moving Average (SMA): It uses a 50-period SMA to determine the trend direction. If the price is above the SMA, the trend is bullish; if it's below, the trend is bearish.
4. Buy and Sell Signals:
- Buy Signal: Generated when the price is in the discount zone and above the equilibrium, with the price also above the SMA.
- Sell Signal: Triggered when the price is in the premium zone and below the equilibrium, with the price also below the SMA.
5. Order Blocks: It detects basic order blocks by identifying the highest high and lowest low within the last 20 bars. These levels help confirm the buy and sell signals.
6. Liquidity Zones: It marks the swing high and low as potential liquidity zones, indicating where price may reverse due to institutional players' activity.
The strategy then executes trades based on these signals, plotting buy and sell markers on the chart and showing the key levels (zones) and trend direction.

SMC Order Block & Liquidity EntryThe SMC Order Block and Liquidity Trap Entry Strategy script uses Smart Money Concepts (SMC), which analyze institutional actions in the market, to assist traders in identifying high-probability trades. In order to help traders match their entry with institutional activity, this script highlights important regions of interest, including order blocks, liquidity zones, and indications for Break of Structure (BOS) or Change of Character (CHoCH).
The fundamental ideas of this approach, which focuses on regions where institutions frequently make sizable orders or sweep liquidity, are based on SMC principles. Order blocks, which are frequently important support or resistance zones when institutions are involved, are the final bullish or bearish candle before a significant price move in the other direction. There are liquidity zones that show where retail stop-loss orders build up (above recent highs or below recent lows), such as Buy-Side Liquidity (BSL) and Sell-Side Liquidity (SSL). Before changing the direction of the price, institutions could target these zones, giving traders possible chances.
The script depicts liquidity levels above or below recent highs and lows, automatically finds order blocks within a specified lookback time, and looks for BOS (a continuation signal) or CHoCH (a reversal signal). When liquidity retests inside an order block coincide with BOS or CHoCH circumstances, entry signals are produced. While short entries are triggered when the price breaks below the order block and SSL, long entry alerts are triggered when the price breaks above the order block and BSL.

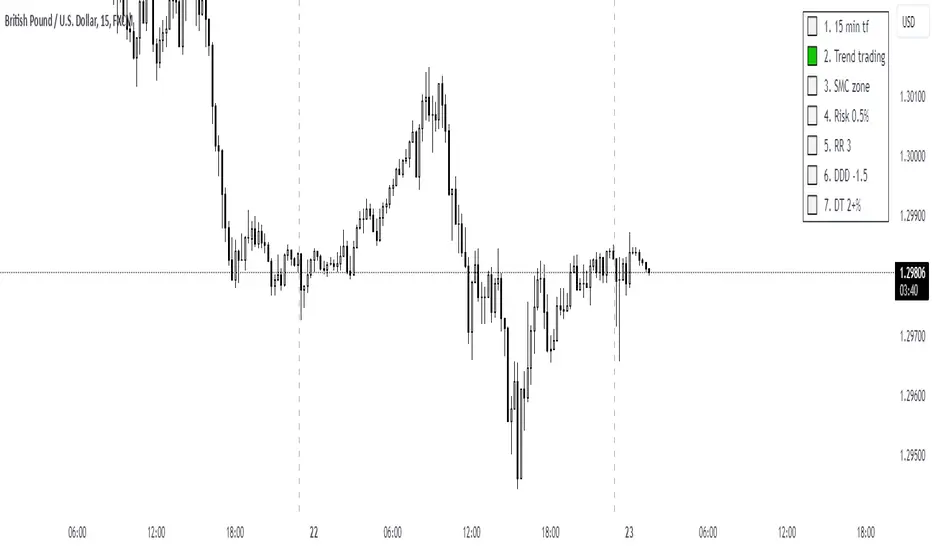
UTC Discipline TradingReminder for Disciplined Trading:
1.Trend Trading – We only open positions in the direction of the trend to take advantage of market momentum.
2.SMC Zones – We trade only within zones defined by the Smart Money Concept (SMC) indicator, identifying key market points.
3.Risk 0.5% – Each position carries a maximum risk of 0.5% of total capital, minimizing potential losses and maintaining risk control.
4.3RR – Every trade must have a risk-to-reward ratio (RR) of 3:1, meaning the potential reward should be three times greater than the risk.
5.DDD -1.5% – When the daily loss reaches -1.5%, trading for the day is closed to avoid further losses.
6.DW 2+% – When daily profit reaches 2%, trading for the day ends. However, if profit exceeds 2%, you may risk an additional amount, and in case of a loss, the day will close with at least 2% profit.
SMT Divergences [OutOfOptions]Smart Money Technique (SMT) Divergence is designed to identify discrepancies between correlated assets within the same timeframe. It occurs when two related assets exhibit opposing signals, such as one forming a higher low while the other forms a lower low. This technique is particularly useful for anticipating market shifts or reversals before they become evident through other Premium Discount (PD) Arrays.
This indicator works by identifying the highs and lows that have formed for an asset on the current chart and the correlated symbol defined in the settings. Once a pivot on either asset is formed, it checks if the pivot has taken liquidity as identified by the previous pivot in the same direction (i.e., a new high taking out a previous high). If this is the case and the corresponding asset has not taken a similar pivot, the condition is determined to be a potential valid divergence. The indicator will then filter out SMTs formed by adjacent candles, requiring at least one candle difference between the candles forming the SMT.
If the “Candle Direction Validation” setting is enabled, the indicator will further check both assets to ensure that for bullish SMTs, the last high on both assets was formed by down candle, and for bearish SMTs, the low was formed by an up candle. This check can often eliminate low-probability SMTs that are frequently broken.
The referenced chart shows divergence between Nasdaq (NQ) and S&P 500 (ES) futures, which are normally closely correlated assets that move in the same direction. The lines shown represent bullish and bearish divergences between the two when they are formed. As you can see from the chart, SMT Divergences may not always indicate a reversal, or a reversal might be just a short-term retrace. Therefore, SMT Divergences should not be used independently. However, in conjunction with other PD arrays, they can provide strong confirmation of a change in market direction.
Configurability:
Pivot strength - Indicates how many bars to the left/right of a high for pivot to be considered, recommended to keep at 1 for maximum detection speed
Candle Direction Validation - Additional SMT validation to filter out weak/low-probability SMTs be examining candle direction
Line Styling for Bullish/Bearish SMTs - Ability to customize line style, color & width for bullish/bearish SMTs
Label Control - Whether or not to show SMT label and if shown what font size & color should be used
What makes this indicator different:
Unlike other SMT indicators, this indicators has additional built-in controls to remove low-probability SMTs
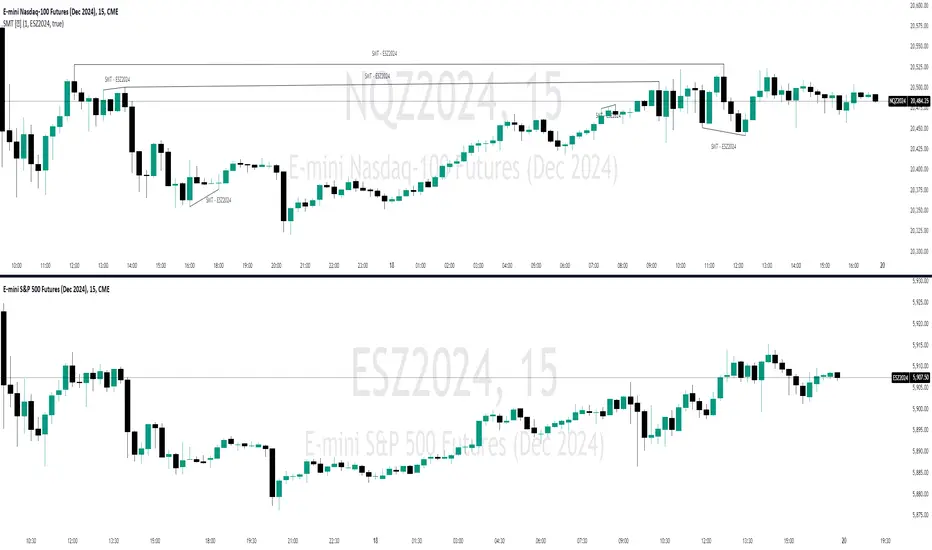
CANSLIM Screener [TrendX_]INTRODUCTION:
The CANSLIM investment strategy, developed by William J. O'Neil, is a powerful tool for identifying growth stocks that have the potential to outperform the market. TrendX has enhanced this approach with its unique indicators, making it easier for investors to assess stocks based on seven critical criteria.
➊ C: Current Quarterly EPS or PE with Growth Benchmark
The first criterion focuses on the Earnings Per Share (EPS) growth in the most recent quarter compared to previous quarters. A company should demonstrate significant EPS growth, ideally exceeding expectations and benchmarks within its industry.
➋ A: Average Annual EPS Growth with Growth Benchmark
This aspect evaluates a company's average annual EPS growth over the last three years. A consistent upward trend suggests that the company is effectively increasing its profitability. TrendX provides a customizable benchmark to help investors identify firms with sustainable growth trajectories.
➌ N: New Highs or New Product Development
TrendX interprets this criterion through an Annual Research & Development to Revenue Ratio (RNDR). A decreasing RNDR ratio may indicate that a company is finishing new products, which could lead to reduced revenue if product launches are unsuccessful.
➍ S: Supply and Demand
This component assesses supply and demand dynamics by analyzing the movement of Float Shares Outstanding. A decrease in float shares typically indicates higher demand for the stock, suggesting that the company is in good shape for future growth.
➎ L: Leader
TrendX employs comparative analysis between the Relative Strength Index (RSI) of a company and that of the overall market. If a company's RSI is higher than the market's, it signifies that the stock is leading rather than lagging.
➏ I: Institutional Sponsorship
Institutional sponsorship is gauged through the total dividends paid by a company. High dividend payouts can signal strong institutional interest, support and confidence in the company's future prospects.
➐ M: Market Direction
TrendX evaluates market direction by comparing a company's RSI against its Moving Average of RSI, along with utilizing Market Structure in Smart Money Concept indicator for alternative trend insights.
HOW TO USE
The TrendX CANSLIM indicator provides an evaluation score based on each of the seven criteria outlined above, which displays in a table containing:
Scoring System: Each letter in CANSLIM contributes to a total score out of 100%. A stock does not need to meet all seven criteria; achieving a score above 70% (5 out of 7) is generally considered indicative of a promising growth stock.
Screening Feature: The tool includes a screening feature that evaluates multiple stocks simultaneously, allowing investors to compare their CANSLIM scores efficiently. This feature streamlines identifying potential investment opportunities across various sectors.
DISCLAIMER
This indicator is not financial advice, it can only help traders make better decisions. There are many factors and uncertainties that can affect the outcome of any endeavor, and no one can guarantee or predict with certainty what will occur.
Therefore, one should always exercise caution and judgment when making decisions based on past performance.
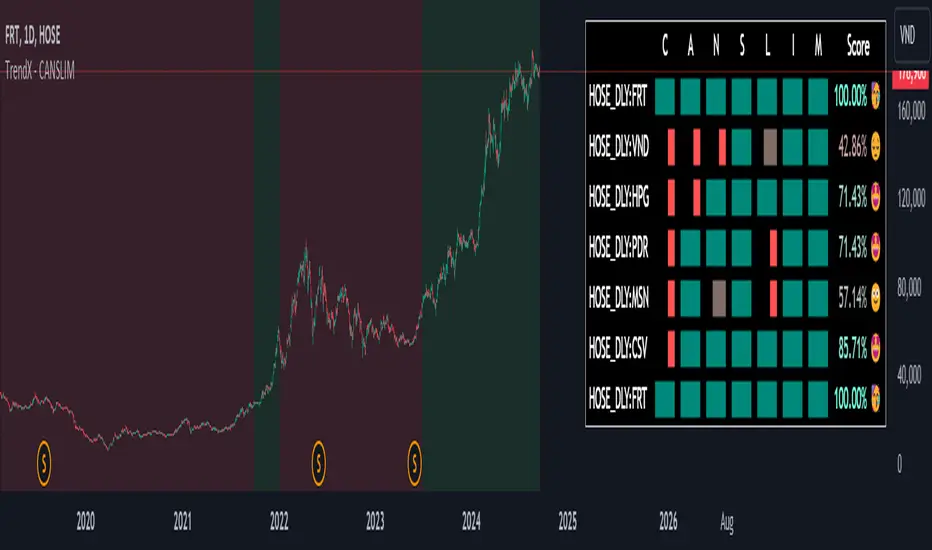
Change in State of Delivery CISD ICT [TradingFinder] Liquidity 1🔵 Introduction
🟣 What is CISD ?
Change in State of Delivery (CISD) is a key concept in technical analysis, similar to Change of Character (ChoCh) and Market Structure Shift (MSS) in the ICT (Inner Circle Trader) and Smart Money trading styles. Like ChoCh and MSS, CISD helps traders identify critical changes in market structure and make timely entries into trades.
To determine the CISD Level, traders typically review the last 1 to 4 candles to identify the first positive or negative candle. The CISD Level is then set using the opening price of the next candle.
In this version of the indicator, support and resistance levels are defined based on liquidity, which includes patterns such as SFP (Swing Failure Pattern), fake breakout, and false breakout.
Bullish CISD :
Bearish CISD :
🔵 How to Use
🟣 Bullish CISD (Change in State of Delivery Upward)
In Bullish CISD, the trend shifts from bearish to bullish after the price hits a liquidity zone, typically indicated by patterns such as SFP, fake breakout, or false breakout.
The steps to identify Bullish CISD are as follow s:
Identify the liquidity zone (SFP, fake breakout).
Review the candles and find the first positive candle.
Set the CISD Level using the opening price of the next candle after the positive candle.
Confirm the change in state of delivery when the price closes above the CISD Level.
Enter the trade after CISD confirmation.
🟣 Bearish CISD (Change in State of Delivery Downward)
In Bearish CISD, the trader looks for a shift from a bullish to a bearish trend. This change typically occurs when the price hits a liquidity level, indicated by patterns such as SFP or false breakout.
The steps to identify Bearish CISD are :
Identify the liquidity zone.
Review the candles and find the first negative candle.
Set the CISD Level using the opening price of the next candle after the negative candle.
Confirm the change in state of delivery when the price closes below the CISD Level.
Enter a short trade after CISD confirmation.
🟣 CISD Compared to ChoCh and MSS (CISD Vs ChoCh/ MSS)
CISD, ChoCh, and MSS are all tools for identifying trend changes in the market, but they have some differences :
CISD: Focuses on a change in the state of delivery and uses liquidity patterns (SFP, fake breakout) and key candles to confirm trend reversals.
ChoCh: Identifies a change in the market’s character, often signaling rapid shifts in trend direction.
MSS: Focuses on changes in market structure and identifies the breaking of key levels as a signal of trend shifts.
🔵 Settings
🟣 CISD Logical settings
Bar Back Check : Determining the return of candles to identify the CISD level.
CISD Level Validity : CISD level validity period based on the number of candles.
🟣 SFP Logical settings
Swing period : You can set the swing detection period.
Max Swing Back Method : It is in two modes "All" and "Custom". If it is in "All" mode, it will check all swings, and if it is in "Custom" mode, it will check the swings to the extent you determine.
Max Swing Back : You can set the number of swings that will go back for checking.
🟣 CISD Display settings
Displaying or not displaying swings and setting the color of labels and lines.
🟣 SFP Display settings
Displaying or not displaying swings and setting the color of labels and lines.
🔵 Conclusion
CISD is a powerful tool for identifying trend reversals using liquidity patterns and key candle analysis. Traders can use the CISD Level to detect trend changes and find optimal entry and exit points.
This concept is similar to ChoCh and MSS but stands out with its focus on confirming trend changes through liquidity and specific patterns. With the right approach, CISD helps traders capitalize on market movements more effectively.

Swing Failure Pattern SFP [TradingFinder] SFP ICT Strategy🔵 Introduction
The Swing Failure Pattern (SFP), also referred to as a "Fake Breakout" or "False Breakout," is a vital concept in technical analysis. This pattern is derived from classic technical analysis, price action strategies, ICT concepts, and Smart Money Concepts.
It’s frequently utilized by traders to identify potential trend reversals in financial markets, especially in volatile markets like cryptocurrencies and forex. SFP helps traders recognize failed attempts to breach key support or resistance levels, providing strategic opportunities for trades.
The Swing Failure Pattern (SFP) is a popular strategy among traders used to identify false breakouts and potential trend reversals in the market. This strategy involves spotting moments where the price attempts to break above or below a previous high or low (breakout) but fails to sustain the move, leading to a sharp reversal.
Traders use this strategy to identify liquidity zones where stop orders (stop hunt) are typically placed and targeted by larger market participants or whales.
When the price penetrates these areas but fails to hold the levels, a liquidity sweep occurs, signaling exhaustion in the trend and a potential reversal. This strategy allows traders to enter the market at the right time and capitalize on opportunities created by false breakouts.
🟣 Types of SFP
When analyzing SFPs, two main variations are essential :
Real SFP : This occurs when the price breaks a critical level but fails to close above it, then quickly reverses. Due to its clarity and strong signal, this SFP type is highly reliable for traders.
Considerable SFP : In this scenario, the price closes slightly above a key level but quickly declines. Although significant, it is not as definitive or trustworthy as a Real SFP.
🟣 Understanding SFP
The Swing Failure Pattern, or False Breakout, is identified when the price momentarily breaks a crucial support or resistance level but cannot maintain the movement, leading to a rapid reversal.
The pattern can be categorized as follows :
Bullish SFP : This type occurs when the price dips below a support level but rebounds above it, signaling that sellers failed to push the price lower, indicating a potential upward trend.
Bearish SFP : This pattern forms when the price surpasses a resistance level but fails to hold, suggesting that buyers couldn’t maintain the higher price, leading to a potential decline.
🔵 How to Use
To effectively identify an SFP or Fake Breakout on a price chart, traders should follow these steps :
Identify Key Levels: Locate significant support or resistance levels on the chart.
Observe the Fake Breakout: The price should break the identified level but fail to close beyond it.
Monitor Price Reversal: After the breakout, the price should quickly reverse direction.
Execute the Trade: Traders typically enter the market after confirming the SFP.
🟣 Examples
Bullish Example : Bitcoin breaks below a $30,000 support level, drops to $29,000, but closes above $30,000 by the end of the day, signaling a Real Bullish SFP.
Bearish Example : Ethereum surpasses a $2,000 resistance level, rises to $2,100, but then falls back below $2,000, forming a Bearish SFP.
🟣 Pros and Cons of SFP
Pros :
Effective in identifying strong reversal points.
Offers a favorable risk-to-reward ratio.
Applicable across different timeframes.
Cons :
Requires experience and deep market understanding.
Risk of encountering false breakouts.
Should be combined with other technical tools for optimal effectiveness.
🔵 Settings
🟣 Logical settings
Swing period : You can set the swing detection period.
SFP Type : Choose between "All", "Real" and "Considerable" modes to identify the swing failure pattern.
Max Swing Back Method : It is in two modes "All" and "Custom". If it is in "All" mode, it will check all swings, and if it is in "Custom" mode, it will check the swings to the extent you determine.
Max Swing Back : You can set the number of swings that will go back for checking.
🟣 Display settings
Displaying or not displaying swings and setting the color of labels and lines.
🟣 Alert Settings
Alert SFP : Enables alerts for Swing Failure Pattern.
Message Frequency : Determines the frequency of alerts. Options include 'All' (every function call), 'Once Per Bar' (first call within the bar), and 'Once Per Bar Close' (final script execution of the real-time bar). Default is 'Once per Bar'.
Show Alert Time by Time Zone : Configures the time zone for alert messages. Default is 'UTC'.
🔵 Conclusion
The Swing Failure Pattern (SFP), or False Breakout, is an essential analytical tool that assists traders in identifying key market reversal points for successful trading.
By understanding the nuances between Real SFP and Considerable SFP, and integrating this pattern with other technical analysis tools, traders can make more informed decisions and better manage their trading risks.

Curious Buy - Sell Indicator - Institutional Zones (Smart Money)How the Script Works:
1. The Scripts identifies Institutional Demand , Supply & Neutral Zones with FIBS on the scripts with Rectangle BOX with labels in advance. User can insert desired start and end value to plot institutional zones
2. Script generates BUY - SELL signals shape based on candle stick formation in live market and labels with BUY - SELL image for easy identification
3. Script gives pop message EXIT SHORT once Buy spotted and candle close above the buy signal and same way EXIT LONG once Sell spotted and candle close below the buy signal
4. Scripts identifies the candle closing above the BUY - SELL signals Eg - If buy spotted the candle closing above the BUY signal with display with BLUE color Candle same way for sell signal the candle closing below the sell signal candle with display with BLACK color candle.
5. Script spots fake signals which are not valid and can be ignored by the end user
6. Three EMA's 20,50,200 has implemented to identify the strength of the market
7. Scripts identifies OPEN = LOW & OPEN = HIGH candle stick to spot the Institutional BUY - SELL activity
8. The script provides visual clues on the chart to help users identify potential trading opportunities.
9. The script provides visual clues on the chart to help users identity potential trading opportunities in live market
10. The looks and parameters of the script can be modified by end user to customize and adapt to different strategy.
11. With the script user can check higher time frame DAILY \ WEEKLY BUY - SELL signals to plan intraday trades and plan safe BUY - SELL positions.
How Users Can Make Profit Using This Script:
1. Identify potential BUY - LONG opportunities: When a valid BUY is detected and condition is met, it is suggested to opening BUY position with stoploss below the BUY signal spotted candle.
Safe users can execute BUY position once BLUE COLOR candle is formed, Wait for pull back to reduce the stoploss
2. Identify potential SELL - SHORT opportunities: When a valid SELL is detected and condition is met, it suggests a potential opening SELL positions with stoploss above the BUY signal spotted candle. Safe users can execute SELL position once BLACK COLOR candle is formed, Wait for pull back to reduce the stoploss.
3. Script generated BUY - SELL signal met target with the Institutional zone. Eg if BUY spotted at demand zone target will be neutral zone & Supply zone.
4. Script designed for user to spot high probability trades when BUY SIGNAL SPOTTED at the Institutional Demand zone same way SELL SIGNAL SPOTTED AT INSTITUTIONAL supply zone.
5. Combine with additional analysis: Users can utilize this script as a tool in their overall trading strategy. They can combine the signals with fundament analysis , market sentiment to make more informed trading decision
6.Set risk management measures: It is important for users to implement proper risk management strategies when trading based on the scripts signals. To avoid potential losses user once spotted BUY - SELL execute the long or short position. Ensure to place the stoploss to avoid potential losses and place the target. Once your trade is moving in your favor
can trial your stoploss to cost and protect the profits.
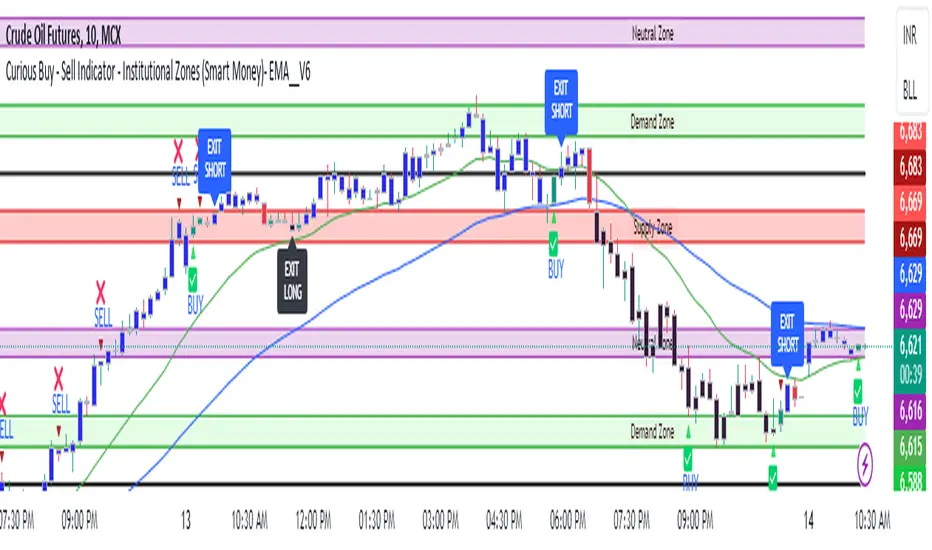
LTF Inducement Levels [QuantVue]Inducement refers to a market manipulation tactic where large institutions or "smart money" create price movements that induce or lure retail traders into taking positions that are ultimately unfavorable. This concept is based on the idea that the market is moved by institutional traders who have the power and capital to manipulate prices to their advantage.
Within a dominant trend, there are frequently movements that go against the prevailing direction. These opposing moves are often driven by liquidity hunting on lower time frames. The price will experience a bounce or rejection, then aim for a previous short-term high or low before resuming its movement in alignment with the longer-term trend. Inducement involves specifically targeting these short-term highs or lows, which are potential zones where stop-loss orders may be located.
The LTF Inducement Levels indicator is designed to identify and display potential lower time frame (LTF) inducement levels on your chart. This indicator helps traders recognize price points where market manipulation might occur without needing multiple charts open.
Once a lower time frame pivot has been crossed, the level is removed from the current chart.
Multi-Timeframe Analysis:
The indicator uses a lower timeframe (LTF) to identify pivot highs and pivot lows, providing a granular view of potential inducement levels.
Configurable Parameters:
Lower Timeframe (LTF): The user can select the lower timeframe for analysis.
Pivot Length: The length used for identifying pivots.
Number of Pivots to Show: Limits the number of pivots displayed on the chart to avoid clutter.
Dynamic Pivot Management:
The indicator dynamically manages the pivots, adding new ones and removing old ones based on the configured maximum number of pivots to show.
It creates lines and labels for each pivot, which are updated as new pivots are formed or crossed.
Inducement Levels:
Pivot Highs: Marked with red lines and labeled with the price value.
Pivot Lows: Marked with green lines and labeled with the price value.
Cross Detection:
The indicator checks if the current price has crossed any of the identified pivots.
Once a pivot is crossed, the corresponding line and label are deleted.
Give this indicator a BOOST and COMMENT your thoughts below!
We hope you enjoy.
Cheers!
